PHONETICS AND PHONOLOGY
Segmental Aspects
SPEECH INTELLIGIBILITY
The term speech intelligibility is understood as comprehensibility of speech, while the degree of comprehensibility is dependable on the acoustic conditions of the environment in which the oral manifestation of speech takes place. “Human natural speech is intelligible in the sound level range of about 80 dB, it is fully intelligible even at very low sound levels down to 40 dB” (Hudcovičová, Petrášová, Rychtáriková, 2022, p. 349). Speech can remain intelligible even when the noise is more intense than speech, or if the speech signal comes from a different direction than the noise. It is a consequence of directional hearing (Rychtáriková, 2011). In our modern, highly developed society, there are many ways how to analyse speech and visualise its characteristic aspects.
Analysis of acoustic parametres of speech is the task for acoustic/ experimental phonetics. The basic acoustic parameters of vowel sounds are frequency, intensity, duration and quality, i.e. wave structure determined by formants in vowels.
The following information clearly explains how the terms of auditory and acoustic phonetics correspond:
FREQUENCY
- = the number of complete repetitions (cycles) of variations in air pressure during one second
- the shorter the cycles, the higher the frequency
- the unit of frequency = Hertz
- human hearing organs can catch the sounds between 20 and 20 000 Hertz (most human sounds are between 80 – 350 Hz)
- a male voice = cca 120 Hz, a female voice = 220 Hz
- frequency = the term used in acoustic phonetics corresponding with the term pitch in auditory phonetics
INTENSITY
- = the amount of energy carried by a sound wave (owing to the variation of air pressure coming from the lungs)
- the unit = decibels (dB), 100 dB = quite loud sound – subjective
- the higher the intensity, the bigger the amplitude of a wave
- intensity (the term used in acoustic phonetics) = loudness (the term used in auditory phonetics)
QUANTITY (duration)
- duration (the term used in acoustic phonetics) = length (the term used in auditory phonetics)
- two categories of length:
- absolute phonetic duration – measurable
- functional phonological length – can cause a change in the meaning of words
- in connected speech – cca 6 – 20 sounds pronounced in one second
QUALITY (wave structure)
- the quality of vowels is determined by formants
- FORMANTS – seen on spectrogram as thick black horizontal bars (characteristic for all voiced sounds)
- vowels – distinguishable by F1 and F2, the formants above F4 determine the speaker´s voice quality
- voiceless consonants don´t have formant structure
(Pavlík, 2000)
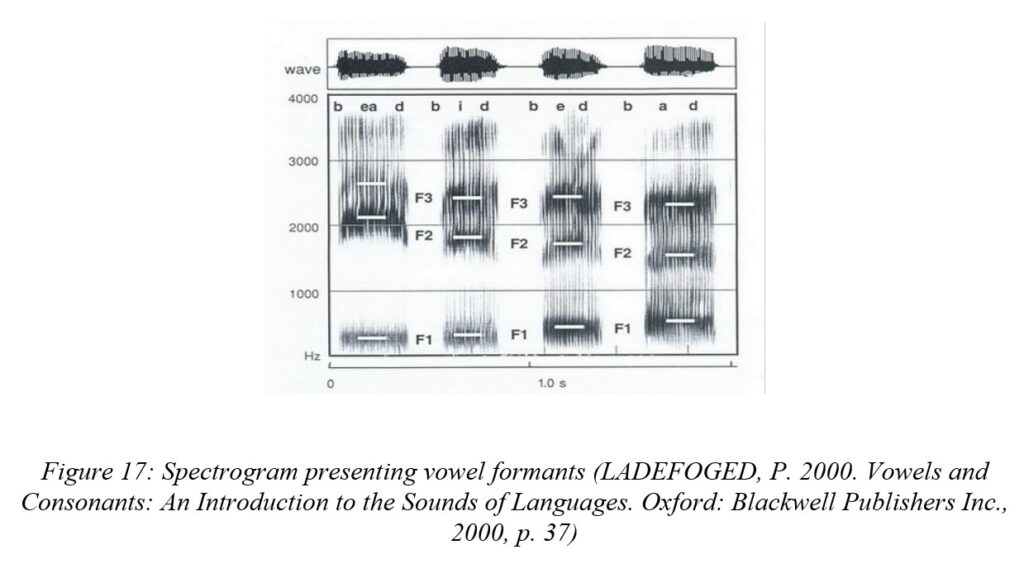
Spectrograms depict the acoustic information manifested in the speech signal and allow the visualisation of the three main properties of sounds: frequency, length, amplitude. The bars seen on the spectrogram are called formants. “The presence of formants in a spectrogram is a characteristic feature of all voiced sounds” (Pavlík, 2000, p. 56). The F1 (formant 1) and F2 (formant 2) values are directly connected to the height and location of vowels:
vowels /i, u/, which are classified as high (close), have low F1 values
vowels /a, o, æ/, which are classified as low (open), have high F1 values.
vowels /i, e/, which are classified as front, have high F2 values
vowels /u, o, a, æ/, which are classified as back, have low F2 values
(Ashby, Maidment, 2005).
The average F2 value is 1500 Hz. “When the vocal folds vibrate, they produce what are called harmonics of their fundamental frequency of vibration. Harmonics are vibrations at whole-number multiples of the fundamental frequency. Thus, when the vocal folds are vibrating at 100 Hz, they produce harmonics at 200 Hz, 300 Hz, 400 Hz, and so on” (Ladefoged, Johnson, 2011, p. 209).
“A spectrogram is a graphical analysis of a sound and offers an analysis in three dimensions. The first (horizontal) dimension represents time, the second (vertical) dimension represents frequency, and the third dimension (distinguished according to the colour intensity of the vertical lines) represents amplitude” (Pavlík, 2000, p. 55). As a result, resonant frequencies of vowel sounds will appear as darker horizontal lines at certain frequencies, and those lines will correspond with the formant values of a vowel sound. F3 parameters reveal the level of nasality in vowel pronunciation (Clark, Yallop, 1995).
For consonants, the manner and place of articulation are the most relevant factors for their classification. According to the F1 value, the size of the constriction gives a clue to the manner of articulation, F2 and F3 values are related to the place of articulation. Formant structure is not recognized for voiceless consonants. Frequency corresponds to resonance in the vocal tract. Its length determines the pitch, i.e. the value of the frequency (Ladefoged, Johnson, 2011). While “vowels carry most of the acoustic energy, consonants contain most of the speech information. Most of the consonants contain frequency components above 1 kHz, and vowels carry most of the information in lower tones” (Petrášová et al., 2016).
The average formant frequencies vary when it comes to differences in a person´s gender or age. The pitch of a sound is of the highest value in children’s voice (300 Hz) and lowest in adult males (110 Hz). Female voice (120-180 Hz) occurs in the middle of the frequency span. The reason is the length of the vocal tract, whereas women generally have a shorter vocal tract than men. A child’s vocal tract is undoubtedly the shortest causing the highest values of formant frequencies (Ashby, Maidment, 2005).
In the spectrogram, “the intensity of the speech sounds is shown by the relative darkness of the marks. The vowels and vowel-like sounds are the darkest, and the different vowel qualities can be clearly seen in the changing pattern of the black bands (formants), which represent varying concentrations of acoustic energy in the vocal tract” (Deterding, 1997, p. 79). Frequency which is measured in Hertz depicts the number of cycles per one second. According to the information provided by Pavlík, ”the human ear is capable of hearing the sounds ranging from 20 to 20 000 Hz, however, most human sounds are recognizable within the frequency scope as narrow as 80 – 350 Hz” (Pavlík, 2000, p. 36).
Table 4: Average formant frequencies of English vowels pronounced by an adult male. WELLS, J. C. 1962. A Study of the Formants of the Pure Vowels of British English. University of London, U.K., available at http://www.phon.ucl.ac.uk/home/wells/formants/index.html
Vowel | F1 (Hz) | F2 (Hz) | F3 (Hz) |
i: | 280 | 2620 | 3380 |
ɪ | 360 | 2220 | 2960 |
e | 600 | 2060 | 2840 |
æ | 800 | 1760 | 2500 |
Ʌ | 760 | 1320 | 2500 |
ɑ: | 740 | 1180 | 2640 |
ɒ | 560 | 920 | 2560 |
ͻ: | 480 | 760 | 2620 |
ʊ | 380 | 940 | 2300 |
u: | 320 | 920 | 2200 |
ɜ: | 560 | 1480 | 2520 |
Table 5: Average formant frequencies of Slovak vowels. KRÁĽ, Á., SABOL, J. 1989. Fonetika a fonológia. Bratislava: SPN, 1989, pp. 204 – 209
Vowel | F1 (Hz) | F2 (Hz) | F3 (Hz) |
i/ i: | 285 | 1916 | 2656 |
e/ e: | 452 | 1718 | 2365 |
a/ a: | 682 | 1315 | 2293 |
o/ o: | 481 | 1084 | 2194 |
u/ u: | 326 | 967 | 2059 |
æ | 700 | 1510 | 2300 |
The other way how to depict speech parameters is using oscillograms. In the specialised literature, the term waveform is sometimes used instead. The horizontal axis represents time directed from left to right. The curve presents the pressure increasing and decreasing in the speech signal.

Nowadays, computer and artificial intelligence technologies, devices and applications are used for analysing speech and giving feedback on “correctness” or accuracy performed in learners´ pronunciation. The acoustic aspects of phonemes could also be evaluated via a computer-assisted software programme PRAAT (Praat software Version 6.1.47; Boersma & Weenink). PRAAT is a free software created by Paul Boersma and David Weenink from the University of Amsterdam. It is used for measuring accuracy and appropriate ways of pronunciation of phonemes and can possibly be used in the educational process, as well. Using the application is much more entertaining for learners and the results achieved provide high informative value to educators.
This computer programme can be used to create auditory spectrograms (or cochleagrams). The software allows the user to do an accurate analysis of spectrograms, cochleagrams, pitch, formants, intensity, along a multitude of other functions. The software is used to recognize formant values of vowel sounds, which allows the identification of the tongue position during the pronunciation of vowels. The program helps to test speech intelligibility by measuring pitch, formants, intensity and duration of sounds. These aspects are fundamental for perceiving speech sounds and decoding them properly.
Computer and AI technologies, devices and applications used for analysing speech are constantly evolving in the contemporary world. Extracting relevant information from the speech signal brings a lot of interesting facts not only about the specific language, but also for the contrastive purposes between various languages.